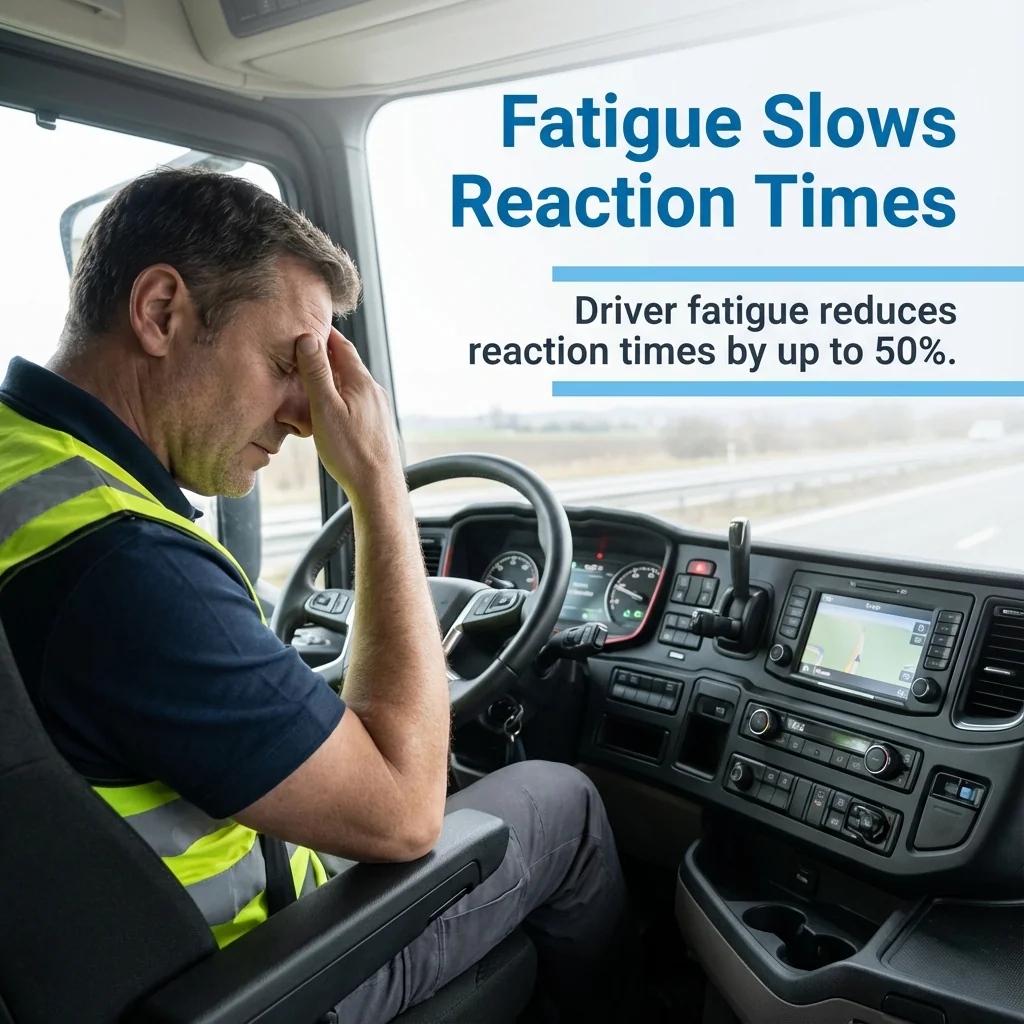
Transport safety issues span seven critical categories that affect every mode of commercial operation. Driver fatigue reduces reaction times by up to 50%, distracted driving accounts for thousands of crashes annually, and vehicle maintenance failures create cascading risks across entire fleets.
Weather-related hazards multiply collision probability, while cargo securement failures endanger both drivers and the public. Slips, trips, and falls remain the most underestimated workplace injury source in transport operations.
Each safety issue connects to broader system failures. Poor training amplifies human error. Inadequate scheduling forces rushed operations. Weak safety culture normalizes risk-taking behavior.
The transportation industry faces mounting challenges. Safety impacts remain among the top management challenges facing the U.S. Department of Transportation for fiscal year 2026. Meanwhile, phishing attacks targeting transportation organizations surged 175% between July 2023 and July 2024, introducing new technological vulnerabilities.

This guide examines each safety hazard through practical compliance frameworks. You’ll learn how specific control measures address root causes, not just symptoms. The focus remains on sustainable prevention strategies that integrate into daily operations.
Understanding these safety issues transforms how transport businesses approach risk management. Proper mitigation reduces insurance costs, protects workers, and strengthens operational reliability across supply chains.
1. Driver Fatigue and Drowsy Driving
Driver fatigue represents the most pervasive safety issue in transportation. Tired drivers exhibit impaired judgment, slower reaction times, and reduced situational awareness equivalent to alcohol impairment.
The problem extends beyond obvious drowsiness. Micro-sleeps lasting just 3-4 seconds occur without warning. At highway speeds, vehicles travel over 100 meters during these brief lapses.
Physiological Impact on Driving Performance
Sleep deprivation affects cognitive function systematically. After 17 hours awake, performance matches someone with a 0.05% blood alcohol concentration. After 24 hours, impairment equals 0.10% BAC.
Commercial truck drivers face unique challenges. Extended hours behind the wheel, irregular schedules, and circadian rhythm disruptions compound fatigue effects. Night shifts particularly increase crash risk.
Physical symptoms provide warning signs. Heavy eyelids, frequent yawning, difficulty focusing, and drifting between lanes all indicate dangerous fatigue levels. Many drivers ignore these signals.
Hours of Service and Fatigue Management
Regulatory frameworks attempt to control fatigue through work-hour restrictions. These rules mandate rest breaks, daily driving limits, and weekly hour caps. Compliance requires accurate record-keeping.
Effective fatigue management extends beyond regulatory minimums. Leading operators implement scheduling systems that account for circadian rhythms. They prioritize sleep quality over mere hours off duty.
Technology supports fatigue detection. In-cab monitoring systems track eye movement, head position, and lane-keeping behavior. Alerts warn drivers before micro-sleeps occur. Driver-facing cameras provide objective evidence of alertness levels.
| Fatigue Indicator | Risk Level | Required Action |
|---|---|---|
| Frequent yawning | Moderate | Plan rest break within 30 minutes |
| Heavy eyelids | High | Stop immediately for 20-minute nap |
| Lane drifting | Critical | Exit road safely and rest minimum 2 hours |
| Missed exits | High | Pull over at next safe location |
| Difficulty focusing | Moderate | Reduce speed and increase following distance |
Prevention strategies focus on sleep hygiene. Drivers need consistent sleep schedules, dark quiet rest environments, and adequate off-duty recovery time. Employers must design rosters that allow proper rest.
2. Distracted Driving and Loss of Awareness
Distracted driving diverts cognitive resources from the primary task of vehicle operation. Mobile phones represent the most common distraction, but many other factors reduce driver attention.
Three distraction categories affect safety differently. Visual distractions take eyes off the road. Manual distractions remove hands from controls. Cognitive distractions occupy mental attention even when eyes remain forward.
Technology-Related Distractions
Mobile phone use while driving creates all three distraction types simultaneously. Texting requires visual focus, manual manipulation, and cognitive processing. Crash risk increases up to 23 times during texting.

Hands-free devices provide false security. Research shows cognitive distraction persists during phone conversations. Drivers miss critical visual cues while mentally engaged in discussions.
In-cab technology adds complexity. GPS navigation systems, dispatch communications, and electronic logging devices all demand driver interaction. System design must minimize distraction potential.
Environmental and Operational Distractions
External factors constantly compete for driver attention. Roadside advertising, other vehicles, pedestrians, and infrastructure all create visual demands. Weather conditions intensify these challenges.
Internal cab distractions include eating, drinking, radio operation, and climate control adjustments. Passengers create additional cognitive load. Professional drivers must manage these factors systematically.
Work pressure generates dangerous distractions. Drivers checking delivery schedules, planning routes, or communicating with dispatch divert attention from immediate driving tasks. Organizations must design workflows that separate planning activities from active driving.
Control Measures for Distraction Prevention
Effective policies establish clear behavioral expectations. Mobile phone bans during vehicle operation must be absolute. No exceptions for stopped-in-traffic use or hands-free devices.
Technology controls include phone-blocking applications that prevent device use while moving. Vehicle systems should integrate dispatch communications with voice-activated interfaces that minimize manual interaction.
Driver training emphasizes hazard prediction and scanning patterns. Systematic visual searches help identify threats early. This proactive approach reduces reactive distraction.
Create distraction-free cab environments. Mount devices securely before departure. Set climate controls and radio stations while stationary. Plan routes before beginning trips.
3. Vehicle Collisions and Traffic Accidents
Vehicle collisions result from complex interactions between human behavior, vehicle condition, road environment, and traffic patterns. Understanding collision mechanics helps target effective prevention strategies.
Per-mile traffic fatality rates run significantly higher for private automobiles than for public transit. Commercial operators face different risk profiles than passenger vehicles.
Common Collision Types and Causes
Rear-end collisions dominate commercial vehicle crashes. Following distances insufficient for vehicle stopping capability create impact inevitability. Heavy vehicle mass and momentum magnify damage severity.
Intersection collisions involve complex decision-making under time pressure. Right-turn blind spots cause cyclist and pedestrian strikes. Left turns across traffic require accurate speed and distance judgment.
Lane-change collisions stem from inadequate mirror checking and blind-spot awareness. Large commercial vehicles have extensive blind zones. Other road users often position themselves invisibly.
Loss-of-control crashes result from excessive speed for conditions. Curves, wet surfaces, or sudden maneuvers exceed available traction. Vehicle rollover becomes likely with improper loading or elevated center of gravity.
Human Factors in Collision Causation
Driver behavior directly influences collision probability. Aggressive driving including tailgating, rapid lane changes, and excessive speed increases crash risk exponentially. Defensive driving provides the counter-strategy.
Perception errors contribute significantly. Drivers misjudge closure rates, especially with larger slower vehicles. They fail to detect motorcycles and cyclists. Expectation bias causes drivers to see what they anticipate rather than actual conditions.
Decision-making under pressure produces errors. Time-sensitive deliveries create rushing behavior. Drivers accept smaller safety margins to maintain schedules. Organizations must design systems that prevent schedule pressure from compromising safety.
Collision Prevention Strategies
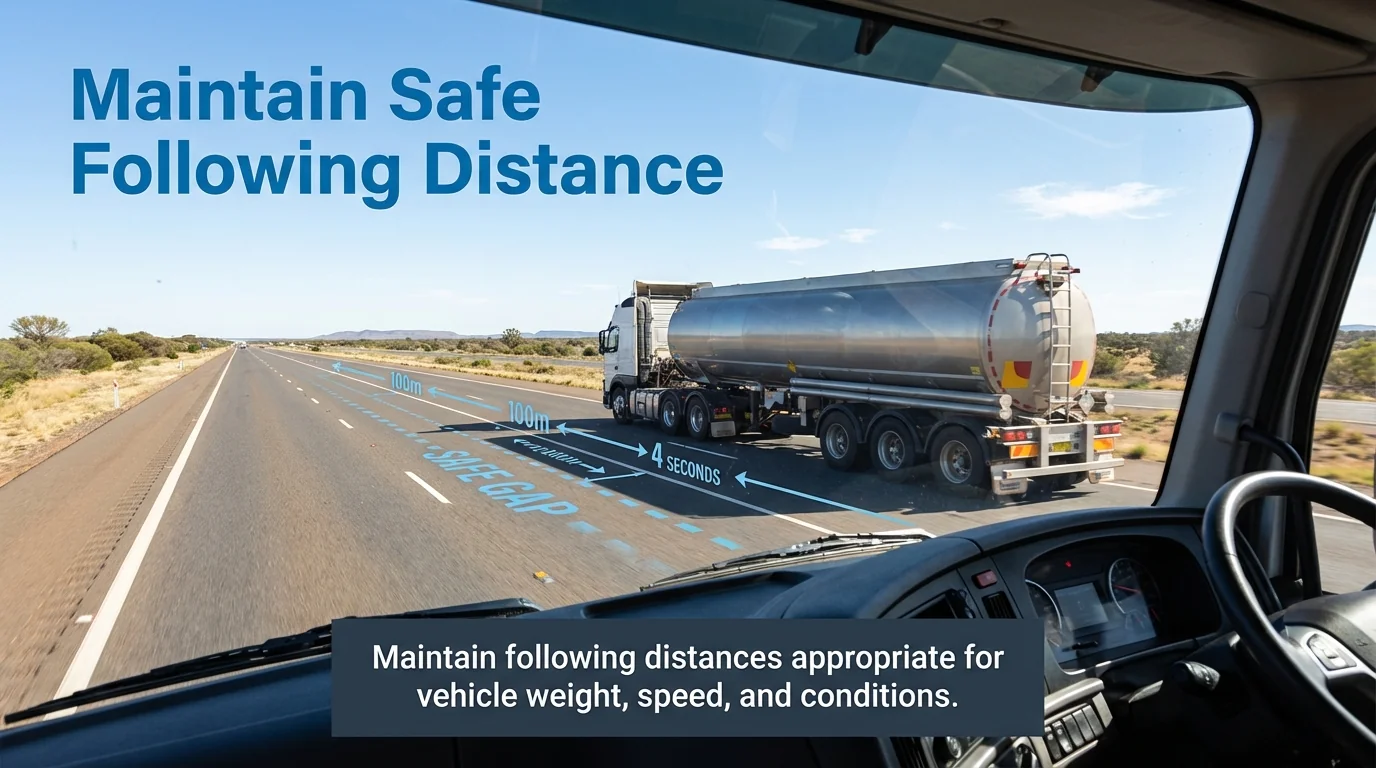
Space management forms the foundation of collision avoidance. Maintain following distances appropriate for vehicle weight, speed, and conditions. The two-second rule applies only to light vehicles in ideal conditions.
Visual scanning disciplines catch hazards early. Check mirrors every 5-8 seconds. Scan 12-15 seconds ahead on highways. Look for escape routes continuously. Anticipate actions of other road users.
Speed management adapts to conditions. Posted limits represent ideal-condition maximums. Reduce speed for weather, traffic density, visibility, and road surface quality. Heavy vehicles require greater stopping distances.
| Collision Type | Primary Cause | Key Prevention Measure |
|---|---|---|
| Rear-end | Insufficient following distance | Maintain 4-second gap minimum for trucks |
| Intersection | Poor visibility and judgment | Reduce speed and scan all approach directions |
| Lane change | Blind spot awareness | Double-check mirrors and blind spots before moving |
| Loss of control | Speed too fast for conditions | Reduce speed 30-50% in adverse conditions |
Advanced driver assistance systems provide additional protection. Automatic emergency braking detects imminent collisions and applies brakes. Lane departure warnings alert drivers to unintended drift. Blind-spot monitoring systems indicate when other vehicles occupy dangerous zones.
4. Poor Vehicle Maintenance and Equipment Failure
Vehicle maintenance failures create safety hazards that affect both operators and other road users. Mechanical defects contribute to crashes, breakdowns, and cargo incidents across all transportation modes.
The relationship between maintenance and safety operates on multiple levels. Immediate failures like brake system defects cause direct incidents. Progressive deterioration gradually reduces safety margins until critical failure occurs.
Critical Safety Systems Requiring Maintenance
Brake systems demand rigorous attention. Worn pads, contaminated fluid, or air system leaks compromise stopping capability. Heavy vehicle brake failures create catastrophic crash potential.
Tire condition directly affects vehicle control. Tread depth below legal minimums reduces wet-surface traction. Under-inflation causes heat buildup and blowout risk. Over-inflation creates uneven wear and harsh ride quality.
Steering and suspension components maintain directional stability. Worn ball joints, damaged shock absorbers, or loose steering linkages reduce control authority. Vehicle handling becomes unpredictable.
Lighting systems enable visibility and communication. Failed headlights limit night operation. Broken brake lights prevent following drivers from recognizing deceleration. Turn signal failures create intersection collision risk.
Maintenance Program Development
Effective programs combine scheduled servicing with condition-based assessment. Manufacturer recommendations establish baseline service intervals. Operating conditions may require more frequent attention.
Pre-trip inspections catch developing problems before departures. Drivers must check critical safety systems daily. Systematic inspection processes ensure consistent coverage of essential components.
Record-keeping tracks maintenance history and identifies recurring problems. Digital systems streamline documentation and trigger service reminders. Fleet managers need visibility into vehicle condition across operations.
Compliance and Legal Requirements
Regulatory standards mandate minimum maintenance requirements. Vehicle standards legislation specifies acceptable component conditions. Operators must demonstrate compliance through documented maintenance programs.
Chain of Responsibility frameworks extend liability beyond drivers. Everyone in the supply chain who influences vehicle operation shares responsibility for maintenance adequacy. This includes schedulers, loaders, and facility operators.
Defect reporting systems allow drivers to identify problems immediately. Vehicles with safety-critical defects must be removed from service until repaired. Proper processes prevent pressure to operate unsafe equipment.
Address maintenance defects systematically. Prioritize safety-critical repairs over operational convenience. Budget adequately for preventive maintenance. Establish relationships with qualified service providers.
5. Weather-Related Driving Hazards
Weather conditions dramatically alter safe operating parameters. Rain, fog, ice, snow, and wind create hazards that require specific response strategies. Many weather-related crashes stem from failure to adapt driving behavior.
Environmental conditions affect multiple vehicle systems simultaneously. Reduced visibility limits hazard detection. Decreased traction compromises control authority. Wind forces affect vehicle stability.
Wet Surface Operation
Rain reduces tire-road friction by 30-50% depending on intensity. Hydroplaning occurs when water layers prevent tire contact with pavement. Speed, tire tread depth, and water depth all influence hydroplaning onset.
Braking distances increase substantially on wet surfaces. Vehicles require 50-100% more distance to stop compared to dry conditions. Heavy vehicles with loaded weight face even greater challenges.
Visibility deteriorates during rain. Windscreen spray from other vehicles obscures forward vision. Side windows collect water that blocks mirror views. Lighting conditions dim even during daytime.
Adjust speed before entering wet conditions. Reduce velocity by 30% minimum in light rain. Heavier precipitation requires greater speed reduction. Test brakes gently after driving through deep water.
Fog and Reduced Visibility Operation
Fog creates deceptive spatial relationships. Drivers misjudge distances to vehicles ahead. Tail lights appear farther away than actual position. Peripheral vision narrows dramatically.
Dense fog requires extreme speed reduction. Visibility under 50 meters demands speeds under 40 km/h. Stopping capability must match visible road distance. Many drivers maintain inappropriate speeds.
Light selection affects visibility quality. Low beam headlights prevent glare reflection that high beams create. Fog lights positioned below fog layer improve road surface illumination.
Ice and Snow Conditions
Ice eliminates directional control and stopping capability. Black ice on bridges and shaded areas creates invisible hazards. Temperature near freezing produces most dangerous conditions.
Snow depth affects vehicle mobility differently. Light snow (under 50mm) mainly reduces visibility. Deep snow (over 100mm) immobilizes vehicles without sufficient ground clearance. Packed snow becomes ice-like.
Tire selection determines winter operation capability. Standard tires lose effectiveness below 7°C. Winter-rated tires maintain flexibility in cold temperatures. Chains provide maximum traction on ice and packed snow.
Wind Effects on Vehicle Control
High winds affect large commercial vehicles severely. Side gusts push vehicles laterally within lanes. Crosswinds at exposed locations like bridges create sudden stability challenges.
Empty trailers experience greater wind effects than loaded vehicles. High profiles catch more wind force. Tanker vehicles with liquid cargo face load-shift dynamics during wind gusts.
Speed management reduces wind vulnerability. Slower speeds provide more control authority for correction. Firm steering grip prevents wind-induced swerving. Anticipate gusts when passing gaps in windbreaks.
| Weather Condition | Speed Reduction | Critical Actions |
|---|---|---|
| Light rain | Reduce 20-30% | Increase following distance to 4 seconds |
| Heavy rain | Reduce 50% | Use low beams and avoid standing water |
| Dense fog | Match visibility distance | Use low beams and fog lights |
| Ice present | Reduce 70% | Avoid sudden steering or braking inputs |
| High winds | Reduce 30% | Grip wheel firmly and anticipate gusts |
6. Slips, Trips and Falls in Transportation
Slips, trips, and falls represent the most common workplace injury category in transport operations. These incidents occur during loading, unloading, vehicle access, and facility movement activities.
Workplace injury statistics showed fatal work injuries increased by approximately 23% in the warehousing and storage industry in 2021 compared with 2020. Many of these incidents involved falls from height and surface-level falls.

Surface-Level Fall Hazards
Slips occur when foot traction proves insufficient for body movement. Contaminated surfaces from oil, fuel, water, or ice eliminate friction. Smooth-soled footwear compounds the problem.
Trips result from foot contact with unexpected obstacles. Uneven surfaces, raised edges, or debris in walkways create tripping hazards. Poor lighting prevents hazard recognition.
Same-level falls cause significant injuries despite shorter fall distances. Arm and wrist fractures occur during instinctive catch reactions. Back injuries result from awkward landing positions. Head strikes against fixed objects create severe trauma risk.
Vehicle Access and Egress Falls
Cab entry and exit activities generate frequent fall incidents. Three-point contact principles prevent falls but require conscious application. Rushing eliminates safe practices.
Trailer access creates elevated fall risks. Loading dock edges, trailer side doors, and rear openings all present fall potential. Height differences vary with dock adjustment and suspension position.
Ladder usage on vehicles demands proper technique. Maintain three-point contact while climbing. Face ladder while ascending and descending. Never carry items while climbing.
Fall Prevention Strategies
Good housekeeping eliminates surface hazards. Clean up spills immediately. Remove debris from walkways. Maintain clear traffic routes through facilities. Repair damaged walking surfaces promptly.
Footwear selection affects traction capability. Slip-resistant soles with appropriate tread patterns provide better grip. Regular replacement prevents worn-smooth soles from compromising safety.
Lighting quality enables hazard detection. Illuminate loading areas, walkways, and vehicle access points adequately. Eliminate shadows that hide surface irregularities. Provide portable lighting for trailer interiors.
Install and use fall prevention equipment. Handrails on stairs and ramps provide stability. Non-slip surfaces on steps and platforms improve traction. Edge protection at height prevents falls from elevated positions.
Train workers on fall prevention techniques. Teach proper ladder usage. Demonstrate three-point contact for vehicle access. Emphasize taking time over rushing. Build safety culture that values injury prevention.
7. Cargo Loading and Securement Issues
Improper cargo loading and securement creates multiple safety hazards. Load shift during transit affects vehicle stability and control. Inadequate restraints allow cargo to become loose projectiles during sudden stops or collisions.
Load distribution influences vehicle handling characteristics. Front-heavy loading increases front axle loading and reduces rear traction. Rear-heavy distribution lifts front axles and compromises steering. Side-to-side imbalance causes rollover susceptibility.
Load Distribution Principles
Center of gravity position determines stability. Lower centers of gravity improve rollover resistance. Higher centers of gravity reduce safe cornering speeds and increase tip-over risk.
Axle weight limits protect road infrastructure and ensure braking capability. Overloaded axles generate excessive heat in brake systems. Weight distribution must maintain legal limits while optimizing stability.
Calculate load weights before departure. Know empty vehicle weight and cargo weight. Verify total combination weight remains within legal limits. Check individual axle groups comply with regulations.
Securement Methods and Requirements
Restraint systems must prevent forward, rearward, and lateral cargo movement. Acceleration forces during normal driving generate significant loads. Emergency braking creates forces approaching 1G.
Tiedown straps, chains, and load bars provide different restraint capabilities. Each system has working load limits that must exceed cargo weight with appropriate safety factors. Regular inspection catches worn or damaged restraints.
Blocking and bracing prevents cargo contact with vehicle structures. Dunnage materials fill voids and prevent shifting. Specialized equipment like load locks secure specific cargo types.
Securement requirements vary by cargo type. Loose materials require different approaches than palletized goods. Heavy machinery needs specialized restraint systems. Liquid cargo in tanks creates unique stability challenges.
Loading Process Safety
Loading dock operations present multiple hazards. Forklifts, pallet jacks, and manual handling equipment operate in confined spaces. Vehicle movement during loading creates crush risks.
Verify vehicle stability before loading. Set parking brakes. Chock wheels when loading without dock restraints. Ensure trailer nose doesn’t lift during loading sequence.
Communication between loading personnel and drivers prevents incidents. Clear signals indicate when vehicle movement is safe. Designated personnel direct forklift operations. Barriers separate pedestrians from equipment paths.
Inspect cargo securement before departure. Check restraint tension. Verify blocking remains in position. Confirm doors and gates latch properly. Establish procedures that require driver verification.
Re-check securement after initial operation period. Vibration and settlement affect restraint tension. Stop after 50-100 km to verify loads remain secure. Adjust straps as needed.
Implementing Effective Safety Controls
Understanding transportation safety issues means little without systematic implementation of control measures. Effective safety management requires organizational commitment that extends beyond individual driver behavior.
Each safety issue demands specific prevention strategies. Driver fatigue needs roster design that prioritizes recovery. Distracted driving requires technology controls and behavioral policies. Vehicle maintenance demands scheduled programs with adequate resourcing.
Building a Safety Management System
Systematic approaches integrate safety considerations into all operational decisions. Safety protocols must be documented, communicated, and enforced consistently. Everyone in the organization shares responsibility.
Risk assessment identifies hazards and prioritizes controls. Evaluate each operation for potential safety issues. Implement controls following the hierarchy: elimination, substitution, engineering controls, administrative controls, and personal protective equipment.
Training programs build capability throughout the workforce. Drivers need hazard recognition skills. Managers require safety leadership competencies. All personnel must understand their safety responsibilities.
Performance monitoring tracks safety outcomes and leading indicators. Crash rates, near-miss reports, and inspection findings reveal system effectiveness. Regular review identifies improvement opportunities.
Chain of Responsibility Compliance
Modern transport safety legislation extends liability across supply chains. Everyone who influences safety outcomes shares legal responsibility. This includes schedulers, loaders, consignors, and facility operators.
Due diligence requires demonstrable safety systems. Organizations must show reasonable steps taken to prevent safety breaches. Documentation proves compliance efforts. Regular audits verify system effectiveness.
Safety culture determines whether procedures translate into actual practice. Leadership commitment signals priority. Worker engagement ensures practical implementation. Continuous improvement demonstrates organizational learning.
Technology enables better safety management. Electronic logging devices track hours accurately. Telematics systems monitor driving behavior. Maintenance management software schedules services systematically. These tools support, not replace, human oversight.
Transport safety demands constant attention. Threats evolve as operations change. New vehicles introduce different characteristics. Regulatory updates require response. Weather patterns shift seasonally.
The organizations that succeed make safety integral to business operations. They recognize that incidents damage people, equipment, schedules, and reputations. Prevention costs less than consequences.
Start with one safety issue. Assess current controls. Identify gaps. Implement improvements systematically. Build on success progressively.